


What this notebook covers
This tutorial explains how to integrate W&B with your PyTorch training code so you can track experiments, log metrics and gradients, and version models. Use it to add experiment tracking to an existing PyTorch pipeline.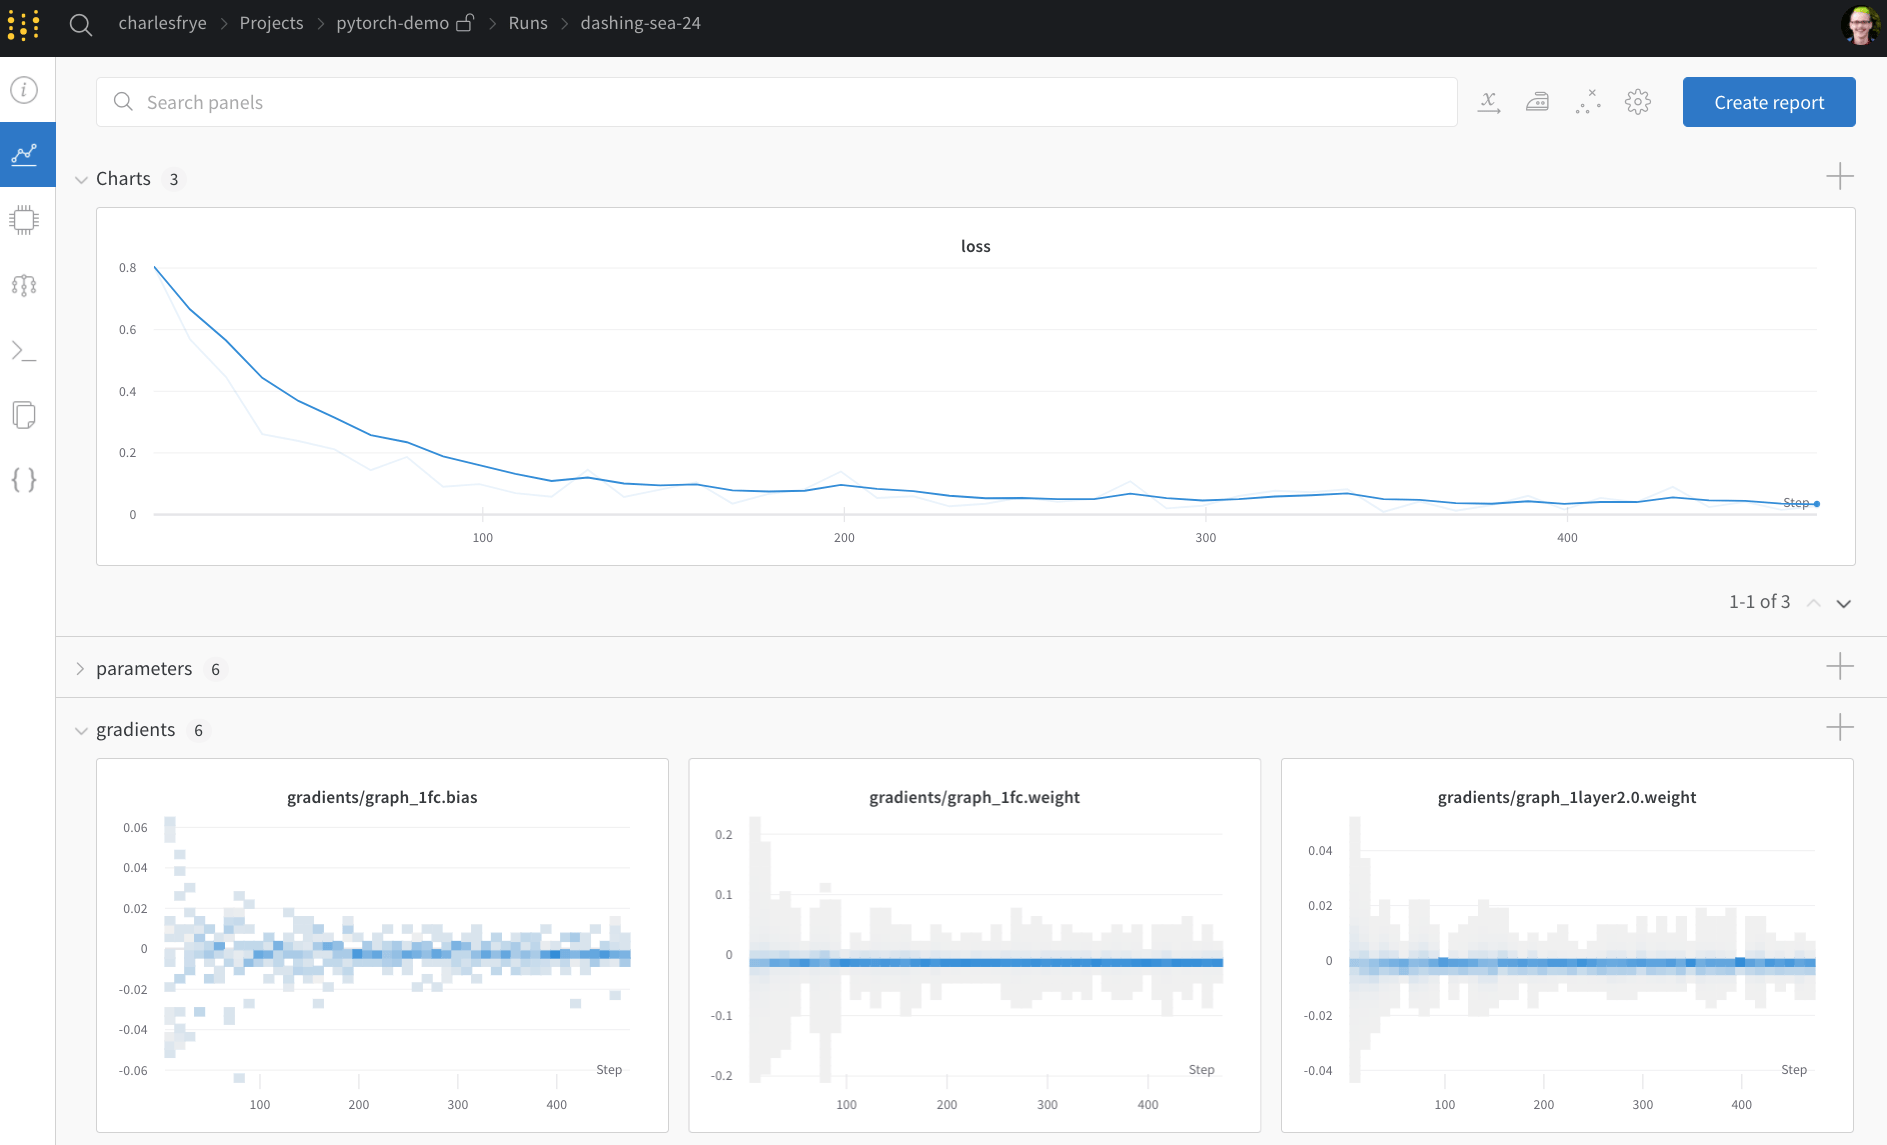
Install, import, and log in
Before defining the experiment, set up the environment and authenticate with W&B.Step 0: Install W&B
To get started, you must install thewandb library with pip.
Step 1: Import W&B and log in
To log data to the W&B service, you must log in. If this is your first time using W&B, sign up for a free account at the link that appears.Define the experiment and pipeline
With W&B installed and your session authenticated, define the experiment configuration and the training pipeline that will use it.Track metadata and hyperparameters with wandb.init()
Programmatically, define your experiment first. What are the hyperparameters? What metadata is associated with this run?
A common workflow is to store this information in a config dictionary (or similar object) and then access it as needed.
This example varies only a few hyperparameters and hand-codes the rest. Any part of your model can be part of the config.
The example also includes metadata for the MNIST dataset and a convolutional architecture. If you later work with, say, fully connected architectures on CIFAR in the same project, this metadata helps you separate your runs.
makea model, plus associated data and optimizer.trainthe model accordingly.testit to see how training went.
wandb.init(). Calling this function sets up a line of communication between your code and W&B servers.
Passing the config dictionary to wandb.init() immediately logs all that information to W&B, so you always know what hyperparameter values you set your experiment to use.
To ensure the values you chose and logged are always the ones used in your model, W&B recommends using the run.config copy of your object. Check the following definition of make to see some examples.
With the pipeline defined, the next sections implement each of its steps in turn: data and model setup, training, and testing.
Side Note: W&B runs its code in separate processes so that any issues on the W&B side don’t crash your code. Once the issue is resolved, you can log the data with wandb sync.
Define the data loading and model
Next, specify how the data is loaded and what the model looks like. This part is important, but it’s no different from what it would be withoutwandb.
wandb, so this example uses a standard ConvNet architecture. Experiment freely with this code. W&B logs all your results on wandb.ai.
Define training logic
Moving on in themodel_pipeline, it’s time to specify how to train. This is where the W&B integration tracks gradients, parameters, and metrics as training proceeds.
Two wandb functions come into play here: watch and log.
Track gradients with run.watch() and everything else with run.log()
run.watch() logs the gradients and the parameters of your model every log_freq steps of training.
Call run.watch() before you start training. For log modes, multiple models, and performance tips, see How do I log gradients and model weights with wandb.watch?.
The rest of the training code remains the same: iterate over epochs and batches, run forward and backward passes, and apply your optimizer.
run.log().
run.log() expects a dictionary with strings as keys. These strings identify the objects being logged, which make up the values. You can also optionally log which step of training you’re on.
Side Note: Using the number of examples the model has seen makes for easier comparison across batch sizes, but you can use raw steps or batch count. For longer training runs, it can also make sense to log by epoch.
Define testing logic
Once the model is done training, test it: run it against some fresh data from production, perhaps, or apply it to some hand-curated examples. Testing also gives you a natural point at which to save the trained model.Optional: Call run.save()
This is also a good time to save the model’s architecture and final parameters to disk. For broad compatibility, export the model in the Open Neural Network eXchange (ONNX) format.
Passing that filename to run.save() ensures that the model parameters are saved to W&B servers: no more losing track of which .h5 or .pb corresponds to which training runs.
For more advanced wandb features for storing, versioning, and distributing models, check out Artifacts tools.
Run training and watch your metrics live on wandb.ai
Now that you’ve defined the whole pipeline and added those few lines of W&B code, you’re ready to run your fully tracked experiment. W&B reports a few links to you: the documentation, the Project page (which organizes all the runs in a project), and the Run page (where this run’s results are stored). Navigate to the Run page and check out these tabs:- Charts, where the model gradients, parameter values, and loss are logged throughout training.
- System, which contains system metrics including Disk I/O utilization and CPU and GPU metrics.
- Logs, which has a copy of anything pushed to standard out during training.
- Files, where, once training is complete, you can click the
model.onnxto view your network with the Netron model viewer.
with wandb.init() block exits, W&B also prints a summary of the results in the cell output.
Test hyperparameters with sweeps
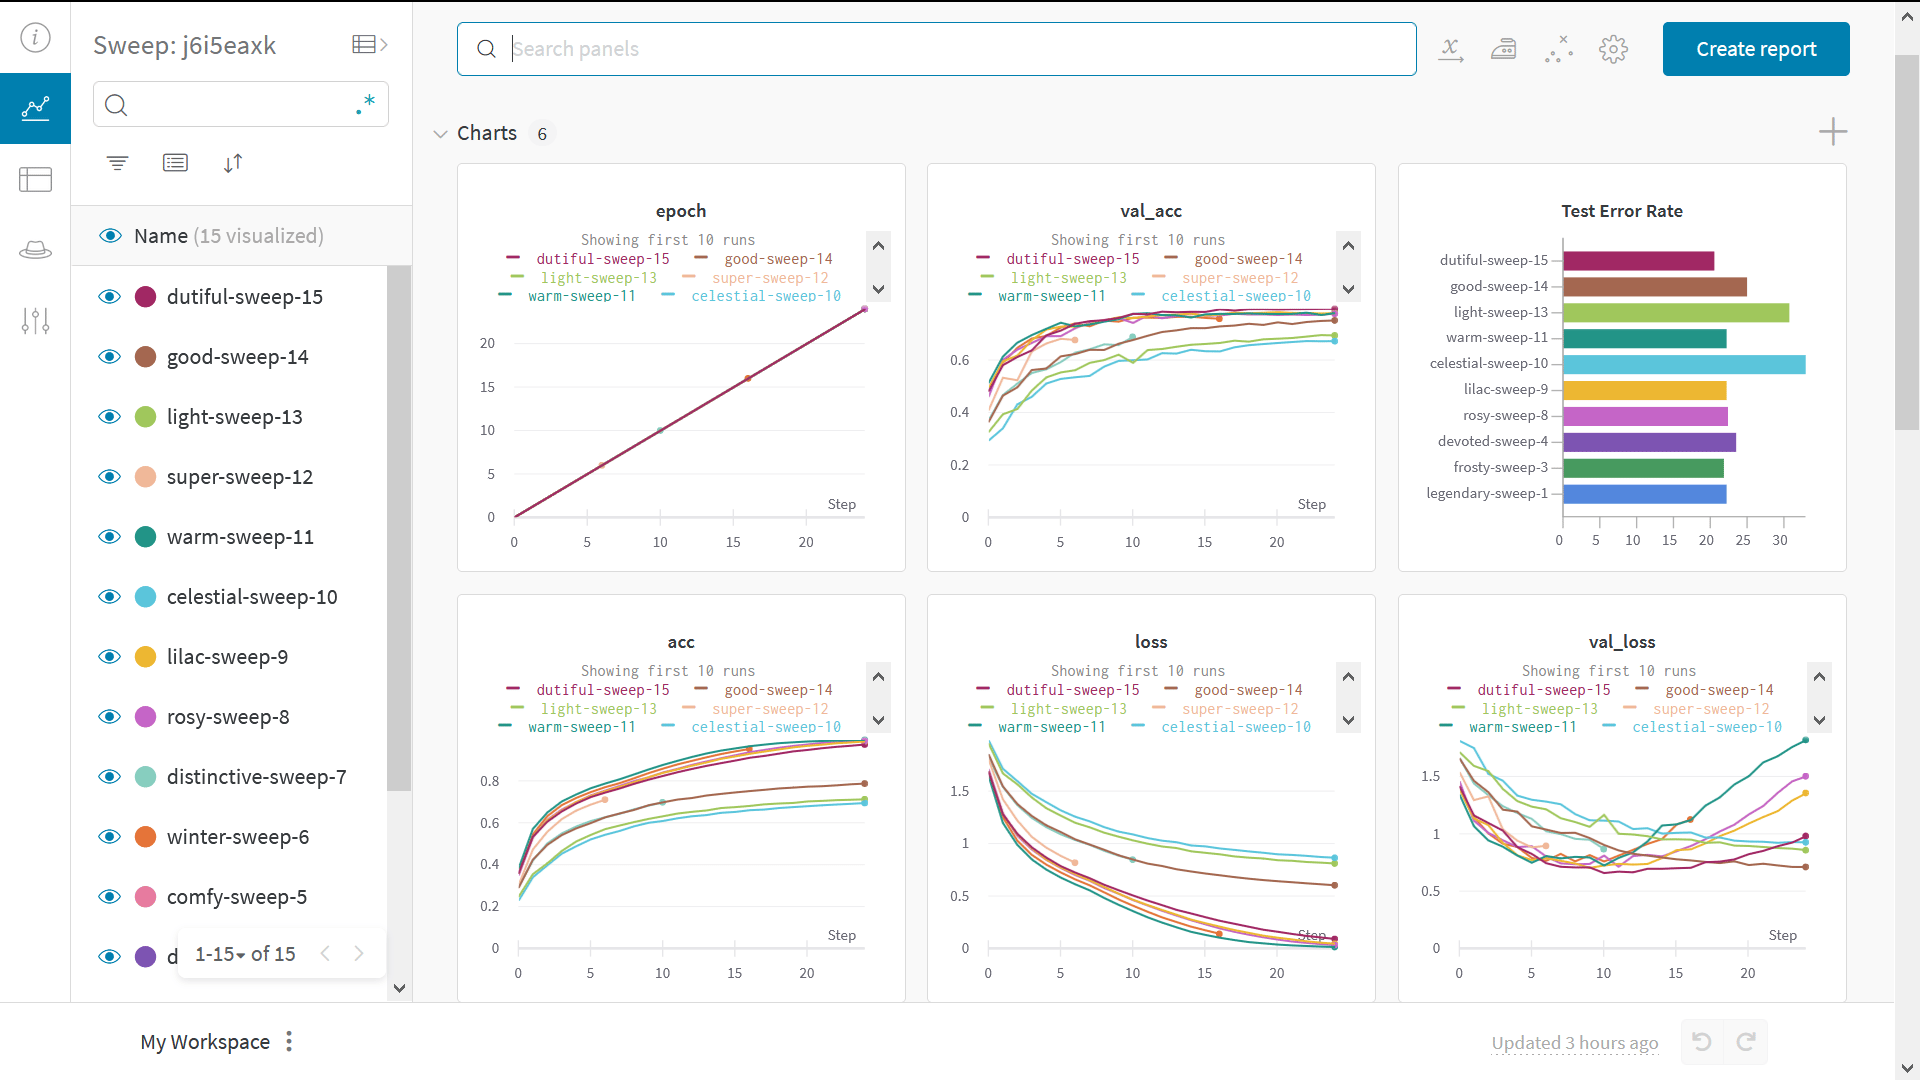
This example only looked at a single set of hyperparameters. An important part of most ML workflows is iterating over several hyperparameters. You can use W&B Sweeps to automate hyperparameter testing and explore the space of possible models and optimization strategies. This lets you scale beyond the previous single-configuration run. Check out a Colab notebook demonstrating hyperparameter optimization using W&B Sweeps. Running a hyperparameter sweep with W&B takes three steps:- Define the sweep: Create a dictionary or a YAML file that specifies the parameters to search through, the search strategy, the optimization metric, and more.
- Initialize the sweep:
sweep_id = wandb.sweep(sweep_config). - Run the sweep agent:
wandb.agent(sweep_id, function=train).
Example gallery
Explore examples of projects tracked and visualized with W&B in the Gallery.Advanced setup
The following options can extend the previous basic workflow for production, offline, or managed environments:- Environment variables: Set API keys in environment variables so you can run training on a managed cluster.
- Offline mode: Use
dryrunmode to train offline and sync results later. - On-premises: Install W&B in a private cloud or air-gapped servers in your own infrastructure.
- Sweeps: Set up hyperparameter search quickly with a lightweight tool for tuning.